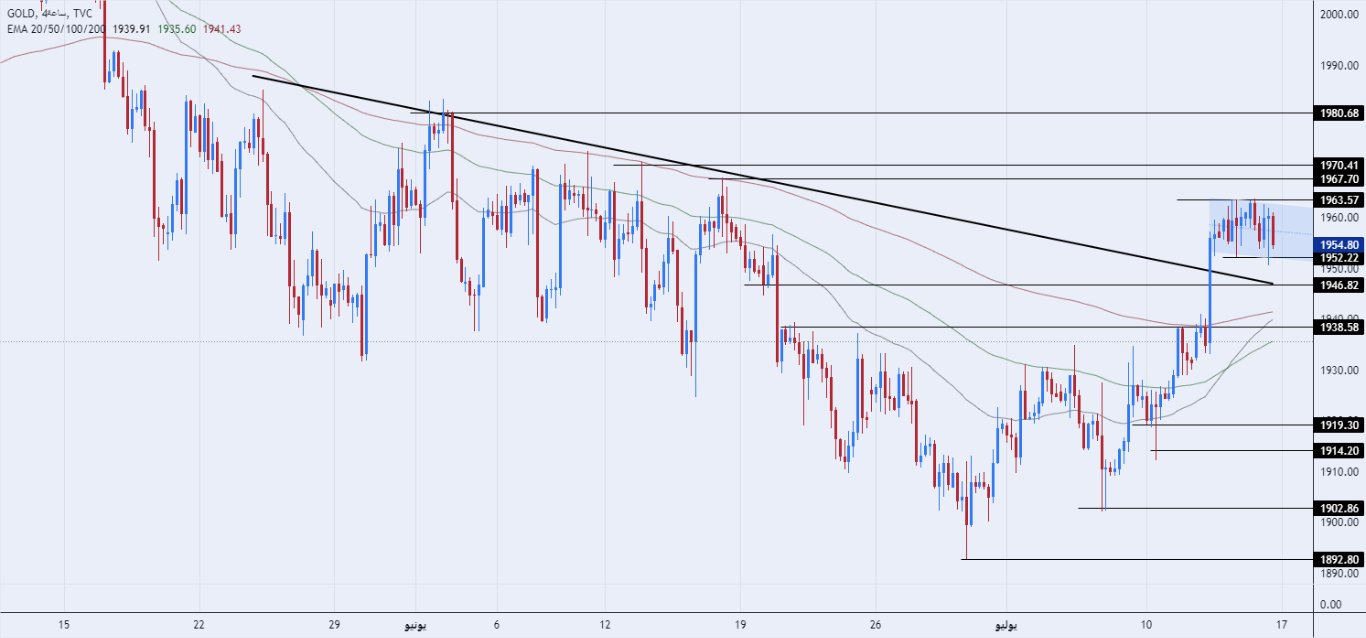
Recommendation for gold for the week against the dollar
- The risk is 0.35%.
- Last week’s short trade was executed and it is still trading
Our recommended forex brokers in the region
Best buy entry points
- Enter a pending buy order from the 1930 levels.
- Best pips points to close stop loss below 1915 levels.
- Move the stop loss to the entry area and take profit when the price rises to $12.
- Close half of the contracts with a profit equal to $15 and leave the remaining contracts up to strong resistance levels in 1980.
Best selling entry points
- Entering Sales Order Pending Order from 1980 levels.
- The best pips points place the stop loss near the 1995 high.
- Move the stop loss to the entry area and take profit when the price rises to $12.
- Close half of the contracts with profit equal to 15 pips and leave the remaining contracts up to support levels 1930.
During the last week’s trade, gold prices rose after the inflation data, while the price remained flat during the weekend trade. Current-month data released last Friday showed the number of jobs in the U.S. rose, but at a slower pace than analysts had expected in June. Inflation data released last week showed a weaker-than-expected fall in inflation in the U.S., in a series of signs of the strength of demand and the success of more than a year of monetary policy. It tightened monetary policy and kept interest rates on hold for more than a year. Ten meetings before setting interest rates during last June’s meeting. Despite expectations of a 25 basis point hike in interest rates during the Federal Open Market Committee meeting, which is expected to be held on the 26th-27th of this month, most expectations point to monetary tightening approaching the peak. Bets on the dollar’s decline were boosted by investment funds and hedges. In this regard, the US currency (going against the path of gold) retreated to its lowest level in about four months.
On the technical side Gold rose during last week’s trade as the price broke the trend line in the four-hour time frame. Also, the price settled into a descending channel on the 60-minute time frame, forming a nice flag pattern. At the moment, gold is trading between strong support levels built in 1946 and 1938 respectively. At the same time, the price is trading above the moving averages of 50, 100 and 200 on the daily time frame and four-hour time frame respectively, which is a sign of a bullish move in the price. Currently, in the medium term, we expect gold to rise, especially if it crosses the price line, so please manage capital and engage in buying and selling transactions according to the daily development of the gold news we mention. On a daily basis.
Map created on the platform Trade show
Follow the gold forecast next week From here

“Award-winning beer geek. Extreme coffeeaholic. Introvert. Avid travel specialist. Hipster-friendly communicator.”
